Spray a Line!!!
What: Sprinkle points along a 2D line and play Why: The equations and inequlities dealing with lines suddenly make better sense Time To Complete: 6 hours

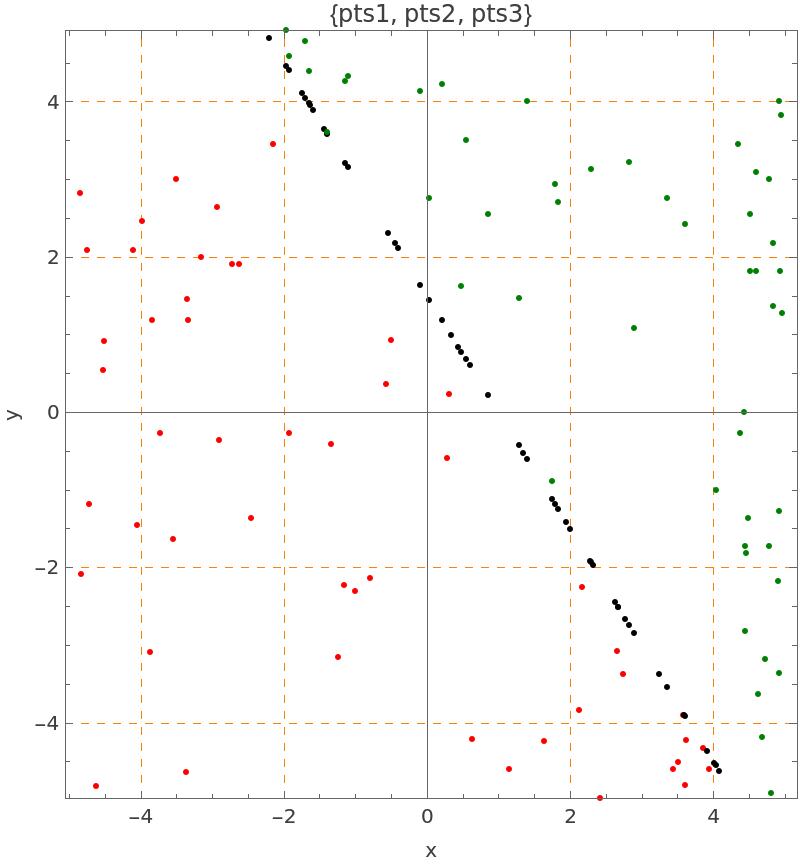
pts2 is your friend the Line! In 2D, any equation of the form ax+by + c = 0 has solutions namely the x and y coordinates that satisfy the identity, namely lhs = rhs, line up along a fixed line specified by the three constants a, b and c.
Pay attention to the function-call color[{red, black,green}]; that sets a list of colors for three plots of points form pts1, pts2 and pts3. As you can see the black color corresponds to the second plot which is obtained from the pts2.
The single line of function-call below: pts2 = instance [linear == 0 and -5<x<5 and -5<y<5 , 50]; linear == 0 set up an equation for 3x+2y-3 to be always 0.
50 is the number of requested randomly generated solutions to the Line Equation 3*x+2*y-3 = 0. -5//do not use the reserved word line, alter e.g. linear;
linear = 3*x+2*y-3;
//points residing on one side of the line;
pts1 = instance [linear < 0 and -5<x<5 and -5<y<5 , 50];
//points residing on the line;
pts2 = instance [linear == 0 and -5<x<5 and -5<y<5 , 50];
//points residing on the other side of the line;
pts3 = instance [linear > 0 and -5<x<5 and -5<y<5 , 50];
//make a list of colors to color the points in each region;
color[{red, black,green}];
//show all points;
pointplot pts1 also pts2 also pts3;
save as trash;
Output
Run the Free Form code again and you should each time get a different distbution of the scattered points.
Output
